Conversations about smart growth and urban density remind me of Teddy Cruz’s comment that density could be re-imagined, from people/things per acre to social exchanges/transactions/relationships per acre. What if density were analyzed through social network analysis? How then would we understand and compare neighborhoods?
Just a thought in preface to my scan through key findings from the new U.S. Environmental Protection Agency Smart Growth program report, “Our Built and Natural Environments,” the second edition of a 2001 publication and a richly cited review of the latest research:
- A bus carrying 20 passengers consumes about one-third of the energy that would be needed if each passenger drove a private vehicle.
- A study of 26 TOD (transit-oriented development) projects in California found that people living within a half-mile of a rail station were about four times as likely to commute by rail as those living between one-half and 3 miles away.
- An evaluation of 17 TOD projects of different sizes in four areas of the country found about 47 percent fewer vehicle trips than predicted using the industry-standard Institute of Transportation Engineers manual.
- A study of 45 of the largest metropolitan regions over 13 years found that the least compact regions had 60 percent more high ozone days than the most compact regions. Of the variables, density was most strongly associated: each standard deviation increase in density was associated with an average of about 16 fewer high ozone days per year.
- A Toronto study found that a low‐density neighborhood was between two and 2.5 times more energy intensive per capita, based on greenhouse gas emissions associated with transportation, infrastructure construction, and building operations, than a high‐density one.
- A study of an ethnically diverse sample of 5,529 adults from six U.S. cities found that when population density and the amount of land devoted to retail uses increases from the fifth percentile to the 95th percentile, the probability of walking more than 150 minutes per week, compared to getting no exercise, increased from 66 percent to 95 percent.
- An analysis of the association between car crashes and urban form in San Antonio, Texas, found that locating retail and commercial uses on arterial streets away from residential areas made streets more dangerous: each additional mile of arterial street was associated with an increase of 15 percent in the number of car crashes and a 20 percent increase in the number of fatal crashes.
- Satellite measurements of nitrogen dioxide levels in 83 cities found a decrease in urban contiguity of one standard deviation to be associated with a 31 percent increase in nitrogen dioxide levels.
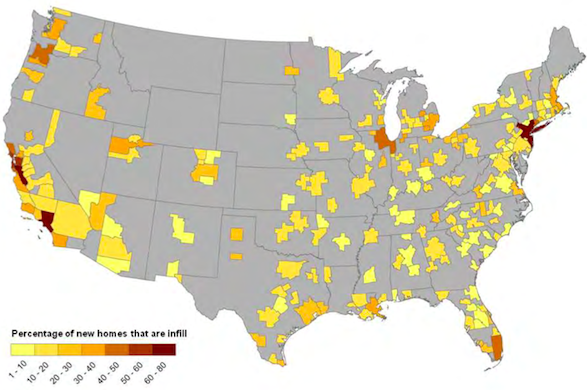
Image: Percentage of new home construction that is infill, 2000‐2009. Source: EPA. 2012. Residential Construction Trends in America’s Metropolitan Regions.